Back in May I published a blockchain analysis piece on Coindesk that utilized graphs created by John Ratcliff. Ratcliff published several new charts yesterday that provide a fuller picture of this overall movement.
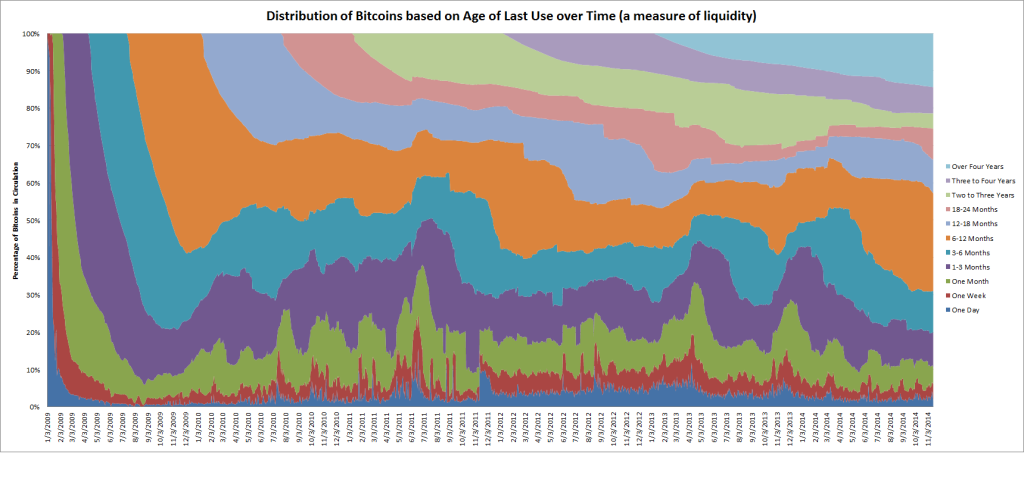
The chart above visualizes nearly 6 years of token movements.
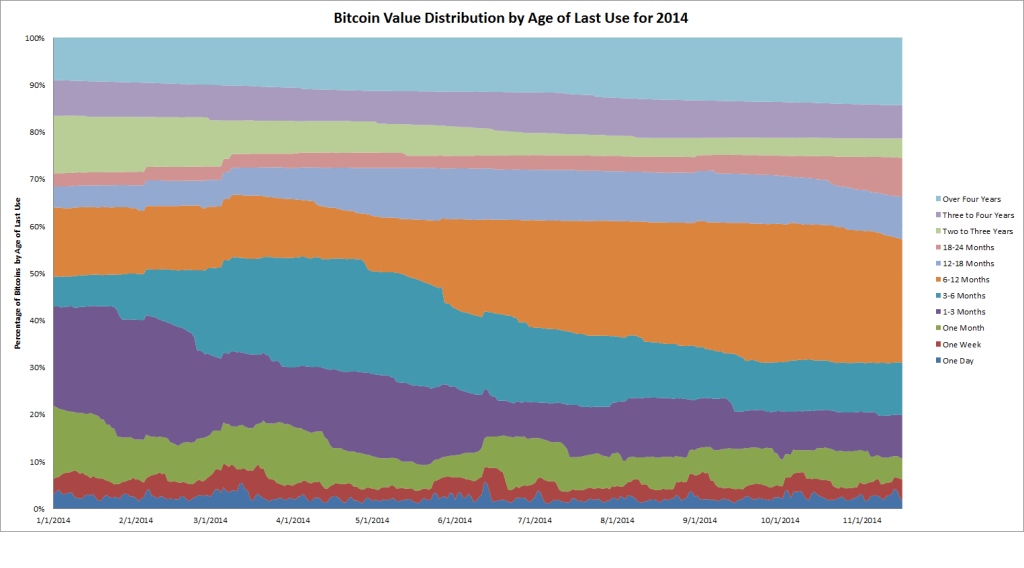
Is there a way to isolate the past year and if so, what does the past year look like? That’s what the next chart illustrates:
What conclusions can be drawn from these charts?
1) that token movement (velocity) strongly correlates with a rapid increase in market prices (e.g., more velocity during the bull runs, less during price decreases); you can see that in the first chart with large bumps in April 2013 and then again in November 2013
2) because of the large dip in prices over the past year, most tokens are inactive in part because the owners are still “underwater”
3) that monthly liquidity is still only around 10% (more on consumption below)
4) the “tx volume” chart on Blockchain.info is no longer entirely valid due to a combination of the usual mixing and mining rewards but also because of increased advertisement spam (e.g., metadata within OP_RETURN), increase in P2SH and Counterparty tx’s. Only a full traffic analysis can provide a more accurate breakdown.
What is especially interesting is to see the “overhang” or rather the “underwater” coins that are moving from the 3 months to the 6-12 month band. What this effectively shows is that owners of those UTXOs purchased them during the bubble of November-December 2013 and are still willing to wait and hold onto these coins until the price rebounds. If there is no upward change in prices then some (or all) of these coins will eventually move into the next band sometime in the spring of 2015.
What other conclusions can be made?
This is a sobering chart for advocates or entrepreneurs within the merchant payment processing vertical. What this shows is that despite the near quadrupling of merchants that now accept bitcoin as payments (this past year increased from ~20k in January to ~76k through September), on-chain activity has not seen a corresponding increase by consumers. They are all effectively fighting for the same thin slice of liquid coins, a segment which empirically has not grown. This does not mean that there are no consumers, only that when paired with data from Bitcoin Day’s Destroyed, there probably hasn’t been any real on-chain growth beyond the exceptions in #4 above. Thus on any given day, payment processors (collectively) likely only process 5,000-6,000 bitcoins still. Other additional activity could be taking place off-chain in trusted third parties (like hosted wallets and exchanges such as Coinbase).
Too reuse an analogy from Chapter 14 (p. 224 and 230), that also means that since 3,600 bitcoins are created each day to pay for security, that with this ratio (3,600 : 6,000) every other mall patron is effectively being guarded by a mall cop which in laymens terms means there is massive security overkill still taking place. This is not a big deal today but when coupled with analysis from Dave Hudson, network transaction fees will have to increase by several orders of magnitude to replace the seigniorage that currently incentivizes miners. This is best illustrated in the cost per transaction metric on Blockchain.info.
As I mentioned on a panel on Tuesday this collective “hodling” (hoarding) behavior is understandable given the future expectations of price appreciation. Yet it is probably not a good characteristic for a modern “currency,” for reasons discussed in Chapter 9 and also Why Market Prices Do Not Double With a Block Reward Halving.
 Send to Kindle